Sales by products
The report is generated only according to the sale documents.
What does it show?
The report shows the efficiency of sales of goods and product groups.
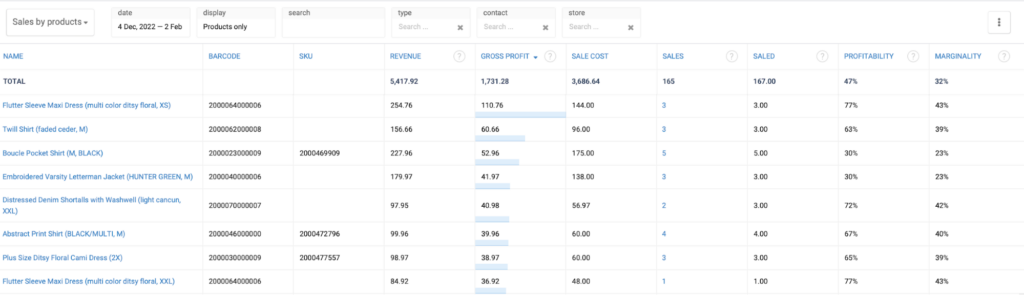
When selling a set, the goods of the composition are recorded in the final document as independent units and are displayed in this report
Displayed here:
- Revenue — the amount of sales of goods excluding refunds.
- Profit — gross profit. It is calculated as the difference between revenue and the cost of goods sold.
- Sale cost — the sum of the cost of goods sold.
- Sales — the number of sales documents.
- Saled — the number of units of goods sold.
- Profitability — the ratio of profit to cost.
- Marginality — the ratio of profit to revenue.
Filters:
- Report period.
- Display. Show groups or only products.
- Type. Goods or services.
- Contact. Filter by customers.
- Store. Filter by points of sale.
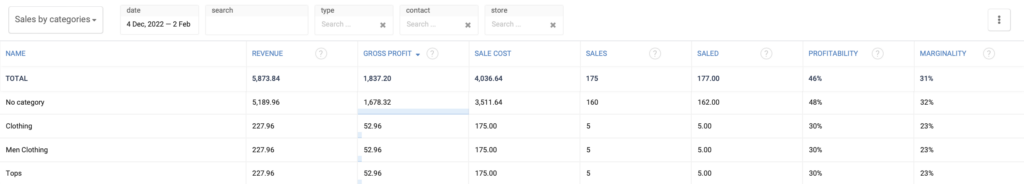
Sales by categories
The report is generated only according to the sale documents.
What does it show?
The report shows the efficiency of category sales.
Attention! Since goods can be assigned several categories at the same time, the sale of such goods will be counted in the lines of each category in the report. In this case, the totals are inaccurate.
Displayed here:
- Revenue — the amount of sales of goods of the category excluding refunds.
- Profit — gross profit. It is calculated as the difference between the revenue and the cost of goods sold in the same category.
- Sale cost — the sum of the cost of goods sold in one category.
- Sales — the number of sales documents.
- Saled — the number of units of goods sold in one category.
- Profitability — the ratio of profit to cost.
- Marginality — the ratio of profit to revenue.
Filters:
- Date range(period).
- Type. Goods or services.
- Contact. Filter by customers.
- Store. Filter by points of sale.
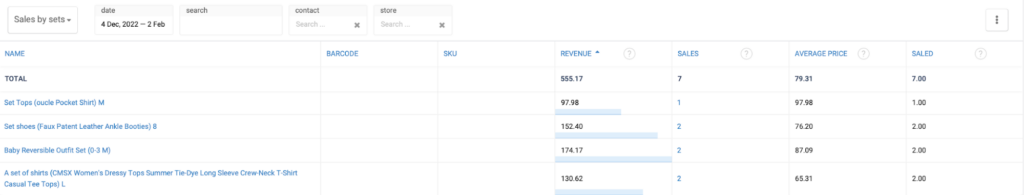
Sales by sets
The report is generated only according to the sale documents.
What does it show?
The report shows the efficiency of sales of sets.
Displayed here:
- Revenue — the amount of sales of goods excluding refunds.
- Sales — the number of sales documents.
- Average price — the ratio of revenue to the number of sets sold.
- Sold — the number of units of sets sold.
Filters:
- Report period.
- Contacts. Filter by customers.
- Stores. Filter by points of sale.